
How to see your screening data on demand with the Veremark Analytics Dashboard


For most client admins, the questions that come up week to week are small. How many checks went out last month. How turnaround is tracking against SLA. Where requests are concentrated by country. The answer is usually a single chart, but it has often meant raising a request and waiting on a report.
The Self-Serve Analytics Dashboard, live in the Veremark platform, removes that wait. It gives client admins a default view of their screening at a glance, and now the tools to build their own tiles for any metric they care about, with an assistant doing the setup.
What is the Veremark Analytics Dashboard?
The Analytics Dashboard is a section in the Veremark platform that shows your screening activity, scoped to your own account. Client admins see an Analytics item in the top navigation. Open it and a default dashboard of ready-made tiles loads immediately.
From there you can switch on edit mode to add your own tiles and arrange the dashboard around how your team works. The full dashboard exports to PDF, so anything you see is ready for a board pack or a stakeholder update.
What can the dashboard show me?
The default view covers the questions client admins ask most often:
- Request volumes by period and by check type
- Turnaround times across your live and completed checks
- Country spread of your candidates
- Order status, including archived orders so your historical view stays complete
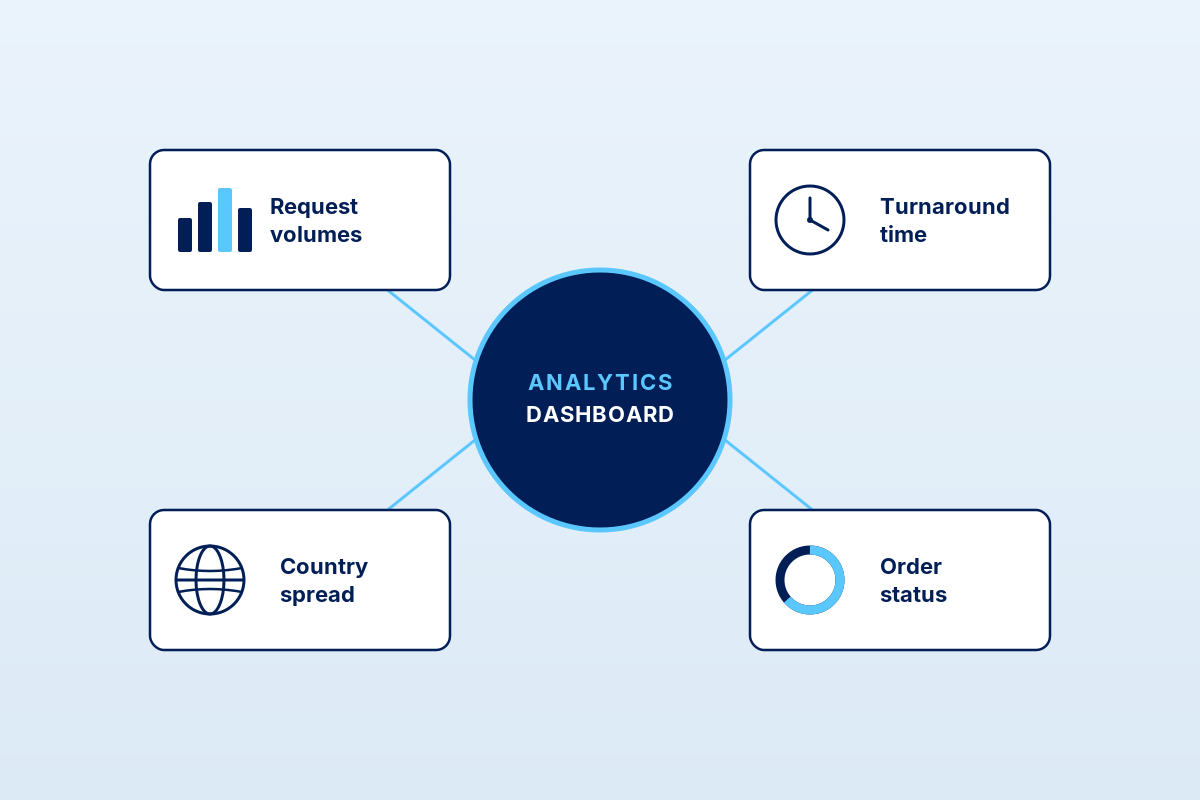
The default tiles cover most of what client admin teams asked for in the discovery interviews that shaped this release. If something is missing, you can now add it yourself.
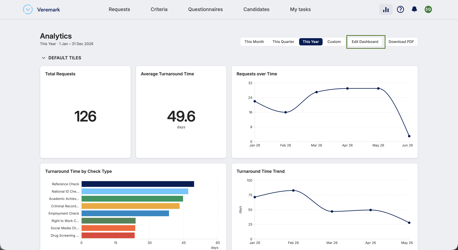
Build your own tiles
Your dashboard is yours to shape. Alongside the default charts, you can create custom tiles, order them how you like, and let a built-in assistant do the setup. You choose what you want to see, it builds the chart, and you decide whether to keep it.
1. Switch on edit mode
Open Analytics, then click Edit Dashboard. The view splits into two areas: Default tiles, the standard charts that were always there, and My tiles, the space that is yours to fill. A banner flags whenever you have unsaved changes, and the controls along the top let you Undo, Reset, Save & Close or Exit at any point.
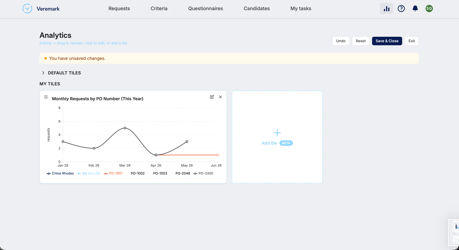
2. Add a tile
Click Add tile and the builder opens on the right, with a live preview that updates as you make choices. There are three short steps.
Build. Choose what to show and how to slice it. Under Show me, pick a metric such as Request Count or Average Turnaround. Under Broken down by, choose how to split it, for example by Country, Check Type or PO Number. Under Shown as, pick a single Total or a Monthly trend, and under For, set the date range: This Month, This Quarter, This Year or a custom range.
Prefer plain English? Expand Or describe it in your own words, type something like “requests by PO, monthly this year”, and click Generate. The assistant reads your description and builds the tile for you. Reword and generate again as often as you like.
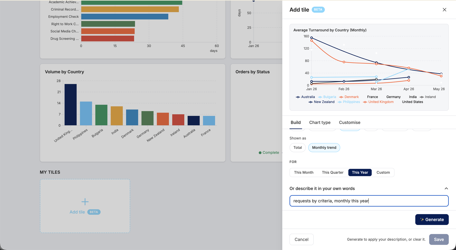
Chart type. Keep the suggested chart or switch it: a single headline number, a line for a trend, a vertical or horizontal bar chart, or a donut.
Customise. Tidy the details: title, axis labels, sort order, how many items to show, units, decimal places and tile size.
3. Save the tile
When the tile looks right, click Save at the bottom of the builder. It appears in your My tiles area. Build as many as you want. To edit a tile later, hover it and use the pencil icon; to remove one, use the cross.
4. Save your dashboard
Adding a tile is not kept until you save the dashboard itself. The You have unsaved changes banner stays visible while you edit. Click Save & Close to keep your tiles, their order and their sizes for next time. Exit leaves edit mode without keeping the latest changes, and Reset clears your custom tiles and returns to the standard dashboard. Once saved, your layout is remembered the next time you open Analytics.
A worked example
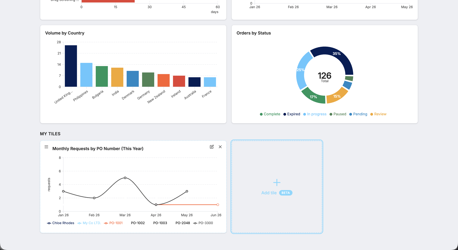
Say you want to see how turnaround varies by country across the year. Under Show me choose Average Turnaround, under Broken down by choose Country, set Shown as to Monthly trend and For to This Year. The assistant builds a line chart titled “Average Turnaround by Country (Monthly)”, one line per country. You like it, so you Save the tile, then Save & Close the dashboard. The whole thing takes under a minute.
A few ideas to start with
- Total requests this year, as a single headline number
- Requests over time, as a monthly trend line
- Average turnaround by check type, to see where time goes
- Volume by country, to see where your hiring is concentrated
- Orders by status, to keep an eye on what is still in progress
Good to know
The assistant only steps in while you are building a tile, and it only ever works from Veremark’s catalogue of metrics. It never invents data and never touches another company’s information. You review every tile before it is saved, and once saved a tile runs as a normal query, so your dashboard stays fast. Your data stays inside your own account, always.
Why use a self-serve analytics dashboard?
Reporting requests have always added a layer of friction between you and the answer. A small question becomes a ticket, then a wait, then a follow-up if priorities shift on either side.
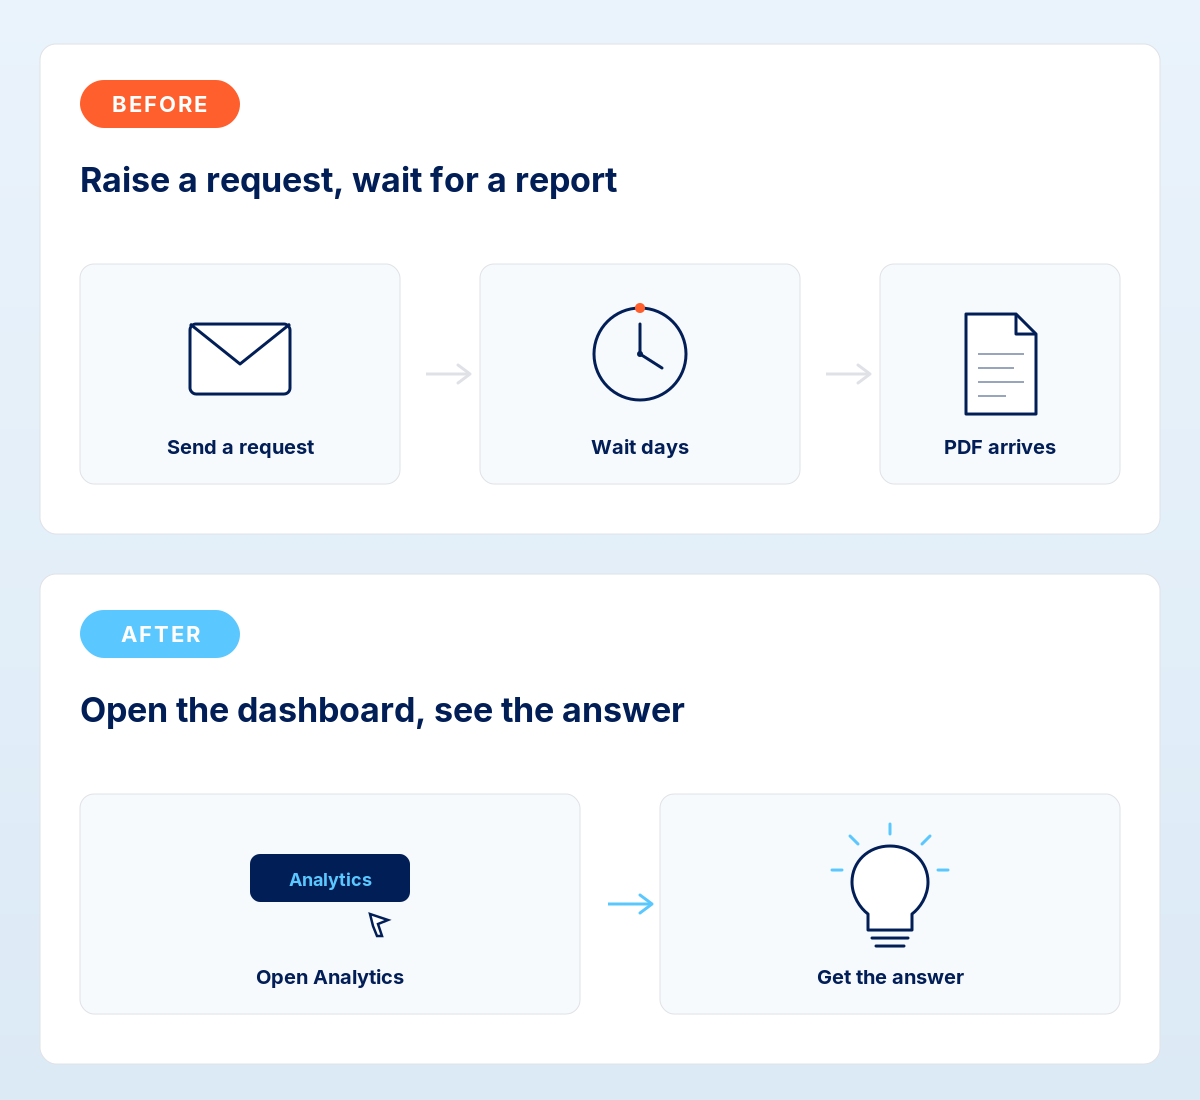
A self-serve dashboard removes that wait for the questions you ask most often, and now for the ones specific to your team. It also makes audit-ready reporting more straightforward, with archived orders included in the dataset so your historical view stays complete.
How do I access the Analytics Dashboard?
The dashboard is live for client admin users in the Veremark platform. Look for the Analytics item in the top navigation. There is nothing to enable and no migration to plan. The default tiles load immediately, and your custom tiles and layout save to your account.
If you would like a walkthrough, or you have a specific reporting need you want help shaping into a tile, speak to your customer success manager.
What’s next for the dashboard?
More metrics, more filters and additional visualisations are on the roadmap, and we are using feedback from this release to decide what ships next.
We are also working towards letting you describe a tile entirely in your own words, with no menus at all. More on that soon.
If a metric you care about is not yet available, tell your customer success manager. That is the best hint for where we look first.
Frequently asked questions
Who can use the Analytics Dashboard?
Client admin users in your Veremark account. Other user roles will see the existing platform navigation.
Do I need to set anything up?
No. The default tiles load as soon as you open the Analytics section. Custom tiles and your layout save automatically to your account.
How do I build my own tile?
Open Analytics, click Edit Dashboard, then Add tile. Choose your metric, breakdown and date range from the menus, or describe what you want in plain English and let the assistant build it. Review the chart, then save.
Can I rearrange the dashboard?
Yes. In edit mode you can drag tiles to reorder them and resize any tile between small, medium and large. Click Save & Close to keep the layout. Reset returns you to the standard dashboard at any time.
Can I export the data?
Yes. The full dashboard exports to PDF.
Are archived orders included?
Yes. Archived orders are part of the dataset, so your historical view stays complete as your account grows.
Does the assistant use my data to train anything, or share it?
No. The assistant only helps while you build a tile and only chooses from Veremark’s catalogue of metrics. You review every tile before it is saved, and your data is never shared across accounts.
What if a metric I want isn’t available?
Tell your customer success manager. Customer feedback shapes what we add next.
If you’d like a walkthrough of the dashboard for your team, speak to your customer success manager.



.png)
FAQs

This depends on the industry and type of role you are recruiting for. To determine whether you need reference checks, identity checks, bankruptcy checks, civil background checks, credit checks for employment or any of the other background checks we offer, chat to our team of dedicated account managers.
Many industries have compliance-related employment check requirements. And even if your industry doesn’t, remember that your staff have access to assets and data that must be protected. When you employ a new staff member you need to be certain that they have the best interests of your business at heart. Carrying out comprehensive background checking helps mitigate risk and ensures a safer hiring decision.
Again, this depends on the type of checks you need. Simple identity checks can be carried out in as little as a few hours but a worldwide criminal background check for instance might take several weeks. A simple pre-employment check package takes around a week. Our account managers are specialists and can provide detailed information into which checks you need and how long they will take.
All Veremark checks are carried out online and digitally. This eliminates the need to collect, store and manage paper documents and information making the process faster, more efficient and ensures complete safety of candidate data and documents.
In a competitive marketplace, making the right hiring decisions is key to the success of your company. Employment background checks enables you to understand more about your candidates before making crucial decisions which can have either beneficial or catastrophic effects on your business.
Background checks not only provide useful insights into a candidate’s work history, skills and education, but they can also offer richer detail into someone’s personality and character traits. This gives you a huge advantage when considering who to hire. Background checking also ensures that candidates are legally allowed to carry out certain roles, failed criminal and credit checks could prevent them from working with vulnerable people or in a financial function.
Trusted by the world's best workplaces


APPROVED BY INDUSTRY EXPERTS
.png)
.png)


and Loved by reviewers


Transform your hiring process
Request a discovery session with one of our background screening experts today.